Who Are We ? The results for the national Census performed in March 2013 have just been released.
New Zealand had a population of 4.2 million people, with a median age of 38. (This means that there were as many people younger than 38 than there were older. Sometimes averages can distort, and the statisticians believe that median is a better measure)
To perform the census, NZ was divided into 39,000 meshblocks, each one averaging 110 people. The statisticians decided to divide the Otaki ward into three areas: Town, Rural & Te Horo population median median age income meshblocks Otaki (town) 5,778 45 $21,600 74 Otaki (rural) 1,488 51 $30,600 16 Te Horo 807 47 $28,700 10 Total Otaki ward 8,073 Total KCDC 49,104 For the purposes of comparison, we compared Otaki against the rest of Kapiti.
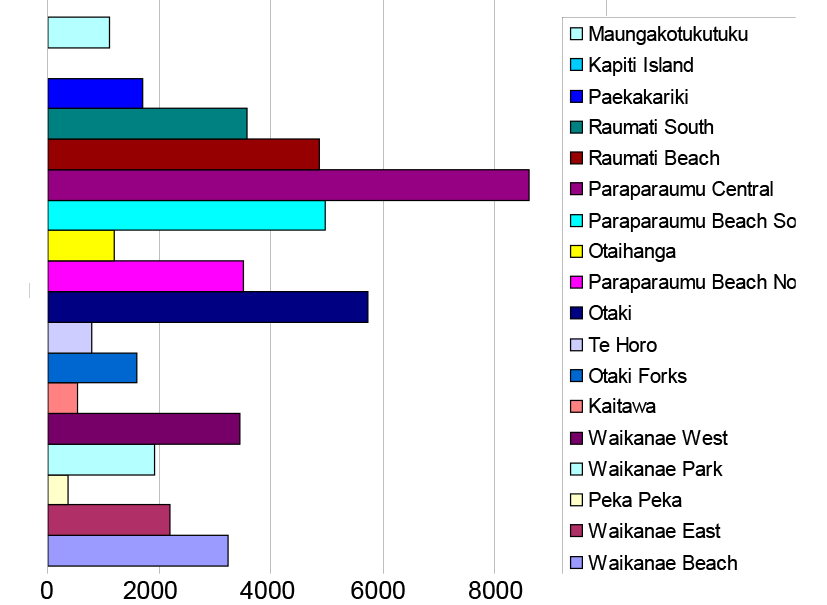
Population-wise, Otaki represent 16% of Kapiti. bigger than Paekakariki and Raumati Beach, but smaller than Paraparaumu and Waikanae. Drilling down into the statistics, there are lots of interesting conclusions.
Where Otaki differs from the rest of Kapiti, we’ve highlighted it.
- Educationally, we’re about the same. Otaki has 10% of its residents with a bachelor’s degree, while Kapiti manages 11%.
- We smoke more than our neighbours. 15% of people claim to be regular smokers, versus 12% in Kapiti. 48% of us say we’ve never smoked, against 52% in Kapiti.
- Occupationally, 46% of us are wage-earners, against Kapiti’s 43%. We have more self-employed (18%) against 15%. In Kapiti 26% report their income coming from ‘other investments’ against our 22%.
- We have fewer superannuitants (30%) than Kapiti’s 34% and the same proportion unemployed (3%) and on the DPB (3%).
Income
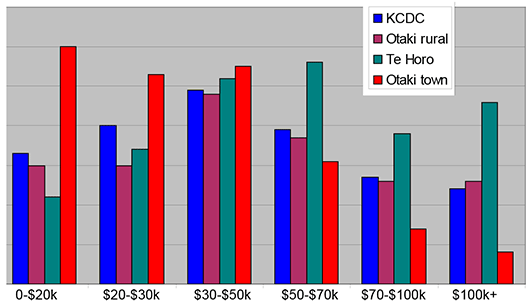
It’s when we look at the relative incomes that we see dramatic differences.
-

Income Distribution in Thousands of Dollars
Kapiti as a whole has most households with incomes between $30,000 and $50,000 Otaki rural has a broadly similar income distribution. - Te Horo has fewer people in the lower income groups and a significant number of higher earners.
- Otaki town has a larger proportion in the lower income groups, and significantly fewer higher income earners.
- What the statistics don’t tell us is that while we may not be a rich town, we are a town of cultural wealth.
The Population of the Kapiti Coast

- Ethnically, we are quite distinct. 72% of Otaki people described themselves as European, against 89% from Kapiti. One third of us claim Maori whakapapa, against only 13% in Kapiti.\
- In Kapiti only 4% claim to speak te reo Maori, while in Otaki you can hear it on the street every day — 17% of us, to be precise.
- More of us are kiwi-born: 85% against 78% in Kapiti.
- Home ownership is lower in Otaki (64%) against 75% in Kapiti.
- The median rental price in Otaki is $220/week against $280/week in Kapiti.
- Most households have a car (90%), while 30% have two vehicles and 9% have three or more.
- We have 492 Businesses in Otaki, against 4,801 in Kapiti.
- There are 1,630 paid employees, against Kapiti’s 11,410.
| Top industries | Otaki | Kapiti |
| Education & Training | 29% | 12% |
| Retail | 22% | 19% |
| Accommodation & food | 9% | 11% |
| Health care | 8% | 15% |
| Manufacturing | 7% | 6% |

